パーセンタイル集約
集約されたドキュメントから抽出された数値に対して1つ以上のパーセンタイルを計算する multi-value メトリクス集約です。これらの値は、ドキュメント内の特定の数値または ヒストグラムフィールド から抽出できます。
パーセンタイルは、観測された値の特定の割合が発生するポイントを示します。たとえば、95パーセンタイルは、観測された値の95%より大きい値です。
パーセンタイルは、外れ値を見つけるためにしばしば使用されます。正規分布では、0.13パーセンタイルと99.87パーセンタイルは平均からの3標準偏差を表します。3標準偏差の外にあるデータは、しばしば異常と見なされます。
パーセンタイルの範囲が取得されると、それらはデータ分布を推定し、データが歪んでいるか、二峰性であるかなどを判断するために使用できます。
データがウェブサイトの読み込み時間で構成されていると仮定します。平均と中央値の読み込み時間は、管理者にとってあまり役に立ちません。最大値は興味深いかもしれませんが、単一の遅い応答によって簡単に歪められる可能性があります。
読み込み時間を表すパーセンタイルの範囲を見てみましょう:
Python
resp = client.search(index="latency",size=0,aggs={"load_time_outlier": {"percentiles": {"field": "load_time"}}},)print(resp)
Ruby
response = client.search(index: 'latency',body: {size: 0,aggregations: {load_time_outlier: {percentiles: {field: 'load_time'}}}})puts response
Js
const response = await client.search({index: "latency",size: 0,aggs: {load_time_outlier: {percentiles: {field: "load_time",},},},});console.log(response);
コンソール
GET latency/_search{"size": 0,"aggs": {"load_time_outlier": {"percentiles": {"field": "load_time"}}}}
フィールド load_time は数値フィールドでなければなりません |
デフォルトでは、percentile メトリクスはパーセンタイルの範囲を生成します:[ 1, 5, 25, 50, 75, 95, 99 ]。レスポンスは次のようになります:
コンソール-結果
{..."aggregations": {"load_time_outlier": {"values": {"1.0": 10.0,"5.0": 30.0,"25.0": 170.0,"50.0": 445.0,"75.0": 720.0,"95.0": 940.0,"99.0": 980.0}}}}
ご覧のとおり、集約はデフォルトの範囲内の各パーセンタイルに対して計算された値を返します。応答時間がミリ秒であると仮定すると、ウェブページは通常10-725msで読み込まれますが、時折945-985msにスパイクします。
多くの場合、管理者は外れ値、つまり極端なパーセンタイルにのみ関心があります。興味のあるパーセンタイルを指定できます(要求されたパーセンタイルは0-100の間の値でなければなりません):
Python
resp = client.search(index="latency",size=0,aggs={"load_time_outlier": {"percentiles": {"field": "load_time","percents": [95,99,99.9]}}},)print(resp)
Ruby
response = client.search(index: 'latency',body: {size: 0,aggregations: {load_time_outlier: {percentiles: {field: 'load_time',percents: [95,99,99.9]}}}})puts response
Js
const response = await client.search({index: "latency",size: 0,aggs: {load_time_outlier: {percentiles: {field: "load_time",percents: [95, 99, 99.9],},},},});console.log(response);
コンソール
GET latency/_search{"size": 0,"aggs": {"load_time_outlier": {"percentiles": {"field": "load_time","percents": [ 95, 99, 99.9 ]}}}}
特定のパーセンタイルを計算するために percents パラメータを使用します |
キー付きレスポンス
デフォルトでは、keyed フラグは true に設定されており、各バケットに一意の文字列キーを関連付け、範囲を配列ではなくハッシュとして返します。keyed フラグを false に設定すると、この動作が無効になります:
Python
resp = client.search(index="latency",size=0,aggs={"load_time_outlier": {"percentiles": {"field": "load_time","keyed": False}}},)print(resp)
Ruby
response = client.search(index: 'latency',body: {size: 0,aggregations: {load_time_outlier: {percentiles: {field: 'load_time',keyed: false}}}})puts response
Js
const response = await client.search({index: "latency",size: 0,aggs: {load_time_outlier: {percentiles: {field: "load_time",keyed: false,},},},});console.log(response);
コンソール
GET latency/_search{"size": 0,"aggs": {"load_time_outlier": {"percentiles": {"field": "load_time","keyed": false}}}}
コンソール-結果
{..."aggregations": {"load_time_outlier": {"values": [{"key": 1.0,"value": 10.0},{"key": 5.0,"value": 30.0},{"key": 25.0,"value": 170.0},{"key": 50.0,"value": 445.0},{"key": 75.0,"value": 720.0},{"key": 95.0,"value": 940.0},{"key": 99.0,"value": 980.0}]}}}
スクリプト
インデックスされていない値に対して集約を実行する必要がある場合は、ランタイムフィールドを使用します。たとえば、読み込み時間がミリ秒であるが、パーセンタイルを秒単位で計算したい場合:
Python
resp = client.search(index="latency",size=0,runtime_mappings={"load_time.seconds": {"type": "long","script": {"source": "emit(doc['load_time'].value / params.timeUnit)","params": {"timeUnit": 1000}}}},aggs={"load_time_outlier": {"percentiles": {"field": "load_time.seconds"}}},)print(resp)
Ruby
response = client.search(index: 'latency',body: {size: 0,runtime_mappings: {'load_time.seconds' => {type: 'long',script: {source: "emit(doc['load_time'].value / params.timeUnit)",params: {"timeUnit": 1000}}}},aggregations: {load_time_outlier: {percentiles: {field: 'load_time.seconds'}}}})puts response
Js
const response = await client.search({index: "latency",size: 0,runtime_mappings: {"load_time.seconds": {type: "long",script: {source: "emit(doc['load_time'].value / params.timeUnit)",params: {timeUnit: 1000,},},},},aggs: {load_time_outlier: {percentiles: {field: "load_time.seconds",},},},});console.log(response);
コンソール
GET latency/_search{"size": 0,"runtime_mappings": {"load_time.seconds": {"type": "long","script": {"source": "emit(doc['load_time'].value / params.timeUnit)","params": {"timeUnit": 1000}}}},"aggs": {"load_time_outlier": {"percentiles": {"field": "load_time.seconds"}}}}
パーセンタイルは(通常)近似値です
パーセンタイルを計算するためのさまざまなアルゴリズムがあります。単純な実装は、すべての値をソートされた配列に保存します。50パーセンタイルを見つけるには、my_array[count(my_array) * 0.5] にある値を見つけるだけです。
明らかに、単純な実装はスケールしません。ソートされた配列は、データセット内の値の数に対して線形に成長します。Elasticsearchクラスター内の数十億の値にわたってパーセンタイルを計算するために、近似パーセンタイルが計算されます。
percentile メトリクスで使用されるアルゴリズムは、TDigest(Computing Accurate Quantiles using T-DigestsでTed Dunningによって導入されました)と呼ばれます。
このメトリクスを使用する際には、いくつかのガイドラインを考慮する必要があります:
- 精度は
q(1-q)に比例します。これは、極端なパーセンタイル(例:99%)が中央値などのあまり極端でないパーセンタイルよりも正確であることを意味します。 - 小さな値のセットでは、パーセンタイルは非常に正確です(データが十分に小さい場合、潜在的に100%正確です)。
- バケット内の値の量が増えるにつれて、アルゴリズムはパーセンタイルを近似し始めます。これは、精度をメモリの節約と引き換えにしていることを意味します。正確な不正確さのレベルは一般化するのが難しいです。なぜなら、それはデータ分布と集約されるデータの量に依存するからです。
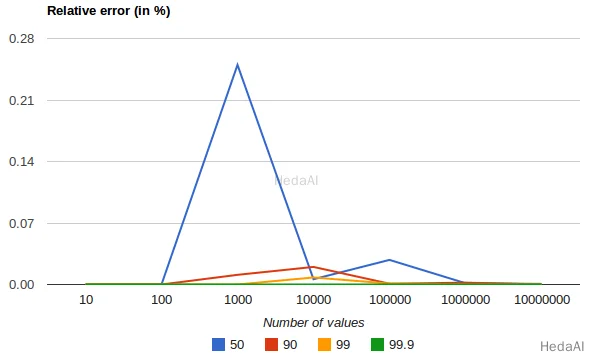
次のチャートは、収集された値の数と要求されたパーセンタイルに応じた均一分布の相対誤差を示しています:

これは、精度が極端なパーセンタイルに対してより良いことを示しています。多くの値に対して誤差が減少する理由は、大数の法則が値の分布をますます均一にし、t-digestツリーがそれを要約するのにより良い仕事をするからです。より歪んだ分布ではそうではありません。
パーセンタイル集約は、非決定的でもあります。これは、同じデータを使用してわずかに異なる結果を得る可能性があることを意味します。
圧縮
近似アルゴリズムは、メモリの利用と推定精度のバランスを取る必要があります。このバランスは、compression パラメータを使用して制御できます:
Python
resp = client.search(index="latency",size=0,aggs={"load_time_outlier": {"percentiles": {"field": "load_time","tdigest": {"compression": 200}}}},)print(resp)
Ruby
response = client.search(index: 'latency',body: {size: 0,aggregations: {load_time_outlier: {percentiles: {field: 'load_time',tdigest: {compression: 200}}}}})puts response
Js
const response = await client.search({index: "latency",size: 0,aggs: {load_time_outlier: {percentiles: {field: "load_time",tdigest: {compression: 200,},},},},});console.log(response);
コンソール
GET latency/_search{"size": 0,"aggs": {"load_time_outlier": {"percentiles": {"field": "load_time","tdigest": {"compression": 200}}}}}
| 圧縮はメモリ使用量と近似誤差を制御します |
TDigestアルゴリズムは、パーセンタイルを近似するためにいくつかの「ノード」を使用します。ノードが多いほど、精度が高く(および大きなメモリフットプリント)、データの量に比例します。compression パラメータは、最大ノード数を 20 * compression に制限します。
したがって、圧縮値を増やすことで、メモリのコストをかけてパーセンタイルの精度を向上させることができます。大きな圧縮値は、基礎となるツリーデータ構造が大きくなるため、アルゴリズムを遅くします。デフォルトの圧縮値は 100 です。
「ノード」は約32バイトのメモリを使用するため、最悪のシナリオ(ソートされて順序通りに到着する大量のデータ)では、デフォルト設定で約64KBのサイズのTDigestが生成されます。実際には、データはよりランダムである傾向があり、TDigestはより少ないメモリを使用します。
実行ヒント
TDigestのデフォルト実装は、パフォーマンスの最適化が行われており、数百万または数十億のサンプル値にスケールしながら、許容可能な精度レベルを維持します(場合によっては数百万のサンプルで相対誤差が1%に近い)。精度を最適化するための実装を使用するオプションがあり、execution_hint パラメータを high_accuracy に設定します:
Python
resp = client.search(index="latency",size=0,aggs={"load_time_outlier": {"percentiles": {"field": "load_time","tdigest": {"execution_hint": "high_accuracy"}}}},)print(resp)
Ruby
response = client.search(index: 'latency',body: {size: 0,aggregations: {load_time_outlier: {percentiles: {field: 'load_time',tdigest: {execution_hint: 'high_accuracy'}}}}})puts response
Js
const response = await client.search({index: "latency",size: 0,aggs: {load_time_outlier: {percentiles: {field: "load_time",tdigest: {execution_hint: "high_accuracy",},},},},});console.log(response);
コンソール
GET latency/_search{"size": 0,"aggs": {"load_time_outlier": {"percentiles": {"field": "load_time","tdigest": {"execution_hint": "high_accuracy"}}}}}
| パフォーマンスの代償として精度のためにTDigestを最適化します |
このオプションは、精度を向上させる可能性があります(場合によっては数百万のサンプルで相対誤差が0.01%に近い)が、その場合、パーセンタイルクエリの完了に2倍から10倍の時間がかかります。
HDRヒストグラム
HDRヒストグラム(高ダイナミックレンジヒストグラム)は、レイテンシ測定のパーセンタイルを計算する際に役立つ代替実装であり、t-digest実装よりも高速である可能性がありますが、より大きなメモリフットプリントのトレードオフがあります。この実装は、固定の最悪のケースのパーセンテージ誤差(指定された有効桁数として)を維持します。これは、データが1マイクロ秒から1時間(3,600,000,000マイクロ秒)までの値で記録されている場合、3桁の有効桁数に設定されたヒストグラムで、1ミリ秒までの値の解像度を1マイクロ秒に、最大追跡値(1時間)に対して3.6秒(またはそれ以上)を維持することを意味します。
HDRヒストグラムは、リクエスト内で hdr パラメータを指定することで使用できます:
Python
resp = client.search(index="latency",size=0,aggs={"load_time_outlier": {"percentiles": {"field": "load_time","percents": [95,99,99.9],"hdr": {"number_of_significant_value_digits": 3}}}},)print(resp)
Ruby
response = client.search(index: 'latency',body: {size: 0,aggregations: {load_time_outlier: {percentiles: {field: 'load_time',percents: [95,99,99.9],hdr: {number_of_significant_value_digits: 3}}}}})puts response
Js
const response = await client.search({index: "latency",size: 0,aggs: {load_time_outlier: {percentiles: {field: "load_time",percents: [95, 99, 99.9],hdr: {number_of_significant_value_digits: 3,},},},},});console.log(response);
コンソール
GET latency/_search{"size": 0,"aggs": {"load_time_outlier": {"percentiles": {"field": "load_time","percents": [ 95, 99, 99.9 ],"hdr": {"number_of_significant_value_digits": 3}}}}}
hdr オブジェクトは、HDRヒストグラムを使用してパーセンタイルを計算する必要があることを示し、このアルゴリズムの特定の設定をオブジェクト内で指定できます |
|
number_of_significant_value_digits は、ヒストグラムの値の解像度を有効桁数で指定します |
HDRヒストグラムは正の値のみをサポートし、負の値が渡されるとエラーになります。また、値の範囲が不明な場合にHDRヒストグラムを使用することはお勧めできません。これは高いメモリ使用量につながる可能性があります。
欠損値
missing パラメータは、値が欠落しているドキュメントがどのように扱われるべきかを定義します。デフォルトでは無視されますが、値があるかのように扱うことも可能です。
Python
resp = client.search(index="latency",size=0,aggs={"grade_percentiles": {"percentiles": {"field": "grade","missing": 10}}},)print(resp)
Ruby
response = client.search(index: 'latency',body: {size: 0,aggregations: {grade_percentiles: {percentiles: {field: 'grade',missing: 10}}}})puts response
Js
const response = await client.search({index: "latency",size: 0,aggs: {grade_percentiles: {percentiles: {field: "grade",missing: 10,},},},});console.log(response);
コンソール
GET latency/_search{"size": 0,"aggs": {"grade_percentiles": {"percentiles": {"field": "grade","missing": 10}}}}
grade フィールドに値がないドキュメントは、値が 10 のドキュメントと同じバケットに入ります。 |
