ジオライン集約
geo_line 集約は、選択した sort フィールドによって順序付けられたバケット内のすべての geo_point 値を LineString に集約します。この sort は、例えば日付フィールドである可能性があります。返されるバケットは、ラインジオメトリを表す有効な GeoJSON Feature です。
Python
resp = client.indices.create(index="test",mappings={"properties": {"my_location": {"type": "geo_point"},"group": {"type": "keyword"},"@timestamp": {"type": "date"}}},)print(resp)resp1 = client.bulk(index="test",refresh=True,operations=[{"index": {}},{"my_location": {"lat": 52.373184,"lon": 4.889187},"@timestamp": "2023-01-02T09:00:00Z"},{"index": {}},{"my_location": {"lat": 52.370159,"lon": 4.885057},"@timestamp": "2023-01-02T10:00:00Z"},{"index": {}},{"my_location": {"lat": 52.369219,"lon": 4.901618},"@timestamp": "2023-01-02T13:00:00Z"},{"index": {}},{"my_location": {"lat": 52.374081,"lon": 4.91235},"@timestamp": "2023-01-02T16:00:00Z"},{"index": {}},{"my_location": {"lat": 52.371667,"lon": 4.914722},"@timestamp": "2023-01-03T12:00:00Z"}],)print(resp1)resp2 = client.search(index="test",filter_path="aggregations",aggs={"line": {"geo_line": {"point": {"field": "my_location"},"sort": {"field": "@timestamp"}}}},)print(resp2)
Ruby
response = client.indices.create(index: 'test',body: {mappings: {properties: {my_location: {type: 'geo_point'},group: {type: 'keyword'},"@timestamp": {type: 'date'}}}})puts responseresponse = client.bulk(index: 'test',refresh: true,body: [{index: {}},{my_location: {lat: 52.373184,lon: 4.889187},"@timestamp": '2023-01-02T09:00:00Z'},{index: {}},{my_location: {lat: 52.370159,lon: 4.885057},"@timestamp": '2023-01-02T10:00:00Z'},{index: {}},{my_location: {lat: 52.369219,lon: 4.901618},"@timestamp": '2023-01-02T13:00:00Z'},{index: {}},{my_location: {lat: 52.374081,lon: 4.91235},"@timestamp": '2023-01-02T16:00:00Z'},{index: {}},{my_location: {lat: 52.371667,lon: 4.914722},"@timestamp": '2023-01-03T12:00:00Z'}])puts responseresponse = client.search(index: 'test',filter_path: 'aggregations',body: {aggregations: {line: {geo_line: {point: {field: 'my_location'},sort: {field: '@timestamp'}}}}})puts response
Js
const response = await client.indices.create({index: "test",mappings: {properties: {my_location: {type: "geo_point",},group: {type: "keyword",},"@timestamp": {type: "date",},},},});console.log(response);const response1 = await client.bulk({index: "test",refresh: "true",operations: [{index: {},},{my_location: {lat: 52.373184,lon: 4.889187,},"@timestamp": "2023-01-02T09:00:00Z",},{index: {},},{my_location: {lat: 52.370159,lon: 4.885057,},"@timestamp": "2023-01-02T10:00:00Z",},{index: {},},{my_location: {lat: 52.369219,lon: 4.901618,},"@timestamp": "2023-01-02T13:00:00Z",},{index: {},},{my_location: {lat: 52.374081,lon: 4.91235,},"@timestamp": "2023-01-02T16:00:00Z",},{index: {},},{my_location: {lat: 52.371667,lon: 4.914722,},"@timestamp": "2023-01-03T12:00:00Z",},],});console.log(response1);const response2 = await client.search({index: "test",filter_path: "aggregations",aggs: {line: {geo_line: {point: {field: "my_location",},sort: {field: "@timestamp",},},},},});console.log(response2);
コンソール
PUT test{"mappings": {"properties": {"my_location": { "type": "geo_point" },"group": { "type": "keyword" },"@timestamp": { "type": "date" }}}}POST /test/_bulk?refresh{"index":{}}{"my_location": {"lat":52.373184, "lon":4.889187}, "@timestamp": "2023-01-02T09:00:00Z"}{"index":{}}{"my_location": {"lat":52.370159, "lon":4.885057}, "@timestamp": "2023-01-02T10:00:00Z"}{"index":{}}{"my_location": {"lat":52.369219, "lon":4.901618}, "@timestamp": "2023-01-02T13:00:00Z"}{"index":{}}{"my_location": {"lat":52.374081, "lon":4.912350}, "@timestamp": "2023-01-02T16:00:00Z"}{"index":{}}{"my_location": {"lat":52.371667, "lon":4.914722}, "@timestamp": "2023-01-03T12:00:00Z"}POST /test/_search?filter_path=aggregations{"aggs": {"line": {"geo_line": {"point": {"field": "my_location"},"sort": {"field": "@timestamp"}}}}}
次のように返されます:
Js
{"aggregations": {"line": {"type": "Feature","geometry": {"type": "LineString","coordinates": [[ 4.889187, 52.373184 ],[ 4.885057, 52.370159 ],[ 4.901618, 52.369219 ],[ 4.912350, 52.374081 ],[ 4.914722, 52.371667 ]]},"properties": {"complete": true}}}}
結果の GeoJSON Feature には、集約によって生成されたパスの LineString ジオメトリと、properties のマップが含まれています。プロパティ complete は、生成されたジオメトリに使用されたすべてのドキュメントが一致したかどうかを示します。size オプション を使用して、集約に含まれるドキュメントの数を制限することができ、complete: false を持つ結果が得られます。どのドキュメントが結果から除外されるかは、集約が time_series に基づいているかどうかによって異なります。
この結果は、マップユーザーインターフェースに表示できます:

オプション
point- (必須)
このオプションは、geo_point フィールドの名前を指定します
my_location をポイントフィールドとして設定する例:
Js
"point": {"field": "my_location"}
sort- (必須、
time_series集約の外)
このオプションは、ポイントの順序付けに使用する数値フィールドの名前を指定します。geo_line 集約が time_series 集約の内部にネストされている場合、このフィールドは @timestamp にデフォルト設定され、他の値を設定するとエラーが発生します。
@timestamp をソートキーとして設定する例:
Js
"sort": {"field": "@timestamp"}
include_sort- (オプション、ブール値、デフォルト:
false) このオプションは、true の場合、フィーチャプロパティにソート値の追加配列を含めます。 sort_order(オプション、文字列、デフォルト:
"ASC") このオプションは、2つの値のいずれかを受け入れます:
“ASC”, “DESC”。ソートキーが “ASC” に設定されている場合、ラインは昇順にソートされ、”DESC” に設定されている場合は降順にソートされます。size- (オプション、整数、デフォルト:
10000) 集約で表されるラインの最大長さ。妥当なサイズは1から10000の間です。time_series内では、集約はライン簡略化を使用してサイズを制約し、それ以外の場合は切り捨てを使用します。なぜ時系列でグループ化するのか? で関与する微妙な点について議論しています。
グルーピング
この単純な例は、クエリによって選択されたすべてのデータの単一トラックを生成します。しかし、データを複数のトラックにグループ化する必要があることがはるかに一般的です。例えば、フライトコールサインによってフライトトランスポンダ測定をグループ化し、各フライトをタイムスタンプでソートして、各フライトのために別々のトラックを生成します。
次の例では、アムステルダム、アントワープ、パリの観光地の位置をグループ化します。トラックは、博物館やその他の観光名所のウォーキングツアーの計画された訪問順序によって順序付けられます。
時系列グルーピングと非時系列グルーピングの違いを示すために、最初に 時系列が有効なインデックス を作成し、次に時系列なしで同じデータをグループ化する例を示します。
Python
resp = client.indices.create(index="tour",mappings={"properties": {"city": {"type": "keyword","time_series_dimension": True},"category": {"type": "keyword"},"route": {"type": "long"},"name": {"type": "keyword"},"location": {"type": "geo_point"},"@timestamp": {"type": "date"}}},settings={"index": {"mode": "time_series","routing_path": ["city"],"time_series": {"start_time": "2023-01-01T00:00:00Z","end_time": "2024-01-01T00:00:00Z"}}},)print(resp)resp1 = client.bulk(index="tour",refresh=True,operations=[{"index": {}},{"@timestamp": "2023-01-02T09:00:00Z","route": 0,"location": "POINT(4.889187 52.373184)","city": "Amsterdam","category": "Attraction","name": "Royal Palace Amsterdam"},{"index": {}},{"@timestamp": "2023-01-02T10:00:00Z","route": 1,"location": "POINT(4.885057 52.370159)","city": "Amsterdam","category": "Attraction","name": "The Amsterdam Dungeon"},{"index": {}},{"@timestamp": "2023-01-02T13:00:00Z","route": 2,"location": "POINT(4.901618 52.369219)","city": "Amsterdam","category": "Museum","name": "Museum Het Rembrandthuis"},{"index": {}},{"@timestamp": "2023-01-02T16:00:00Z","route": 3,"location": "POINT(4.912350 52.374081)","city": "Amsterdam","category": "Museum","name": "NEMO Science Museum"},{"index": {}},{"@timestamp": "2023-01-03T12:00:00Z","route": 4,"location": "POINT(4.914722 52.371667)","city": "Amsterdam","category": "Museum","name": "Nederlands Scheepvaartmuseum"},{"index": {}},{"@timestamp": "2023-01-04T09:00:00Z","route": 5,"location": "POINT(4.401384 51.220292)","city": "Antwerp","category": "Attraction","name": "Cathedral of Our Lady"},{"index": {}},{"@timestamp": "2023-01-04T12:00:00Z","route": 6,"location": "POINT(4.405819 51.221758)","city": "Antwerp","category": "Museum","name": "Snijders&Rockoxhuis"},{"index": {}},{"@timestamp": "2023-01-04T15:00:00Z","route": 7,"location": "POINT(4.405200 51.222900)","city": "Antwerp","category": "Museum","name": "Letterenhuis"},{"index": {}},{"@timestamp": "2023-01-05T10:00:00Z","route": 8,"location": "POINT(2.336389 48.861111)","city": "Paris","category": "Museum","name": "Musée du Louvre"},{"index": {}},{"@timestamp": "2023-01-05T14:00:00Z","route": 9,"location": "POINT(2.327000 48.860000)","city": "Paris","category": "Museum","name": "Musée dOrsay"}],)print(resp1)
Ruby
response = client.indices.create(index: 'tour',body: {mappings: {properties: {city: {type: 'keyword',time_series_dimension: true},category: {type: 'keyword'},route: {type: 'long'},name: {type: 'keyword'},location: {type: 'geo_point'},"@timestamp": {type: 'date'}}},settings: {index: {mode: 'time_series',routing_path: ['city'],time_series: {start_time: '2023-01-01T00:00:00Z',end_time: '2024-01-01T00:00:00Z'}}}})puts responseresponse = client.bulk(index: 'tour',refresh: true,body: [{index: {}},{"@timestamp": '2023-01-02T09:00:00Z',route: 0,location: 'POINT(4.889187 52.373184)',city: 'Amsterdam',category: 'Attraction',name: 'Royal Palace Amsterdam'},{index: {}},{"@timestamp": '2023-01-02T10:00:00Z',route: 1,location: 'POINT(4.885057 52.370159)',city: 'Amsterdam',category: 'Attraction',name: 'The Amsterdam Dungeon'},{index: {}},{"@timestamp": '2023-01-02T13:00:00Z',route: 2,location: 'POINT(4.901618 52.369219)',city: 'Amsterdam',category: 'Museum',name: 'Museum Het Rembrandthuis'},{index: {}},{"@timestamp": '2023-01-02T16:00:00Z',route: 3,location: 'POINT(4.912350 52.374081)',city: 'Amsterdam',category: 'Museum',name: 'NEMO Science Museum'},{index: {}},{"@timestamp": '2023-01-03T12:00:00Z',route: 4,location: 'POINT(4.914722 52.371667)',city: 'Amsterdam',category: 'Museum',name: 'Nederlands Scheepvaartmuseum'},{index: {}},{"@timestamp": '2023-01-04T09:00:00Z',route: 5,location: 'POINT(4.401384 51.220292)',city: 'Antwerp',category: 'Attraction',name: 'Cathedral of Our Lady'},{index: {}},{"@timestamp": '2023-01-04T12:00:00Z',route: 6,location: 'POINT(4.405819 51.221758)',city: 'Antwerp',category: 'Museum',name: 'Snijders&Rockoxhuis'},{index: {}},{"@timestamp": '2023-01-04T15:00:00Z',route: 7,location: 'POINT(4.405200 51.222900)',city: 'Antwerp',category: 'Museum',name: 'Letterenhuis'},{index: {}},{"@timestamp": '2023-01-05T10:00:00Z',route: 8,location: 'POINT(2.336389 48.861111)',city: 'Paris',category: 'Museum',name: 'Musée du Louvre'},{index: {}},{"@timestamp": '2023-01-05T14:00:00Z',route: 9,location: 'POINT(2.327000 48.860000)',city: 'Paris',category: 'Museum',name: 'Musée dOrsay'}])puts response
Js
const response = await client.indices.create({index: "tour",mappings: {properties: {city: {type: "keyword",time_series_dimension: true,},category: {type: "keyword",},route: {type: "long",},name: {type: "keyword",},location: {type: "geo_point",},"@timestamp": {type: "date",},},},settings: {index: {mode: "time_series",routing_path: ["city"],time_series: {start_time: "2023-01-01T00:00:00Z",end_time: "2024-01-01T00:00:00Z",},},},});console.log(response);const response1 = await client.bulk({index: "tour",refresh: "true",operations: [{index: {},},{"@timestamp": "2023-01-02T09:00:00Z",route: 0,location: "POINT(4.889187 52.373184)",city: "Amsterdam",category: "Attraction",name: "Royal Palace Amsterdam",},{index: {},},{"@timestamp": "2023-01-02T10:00:00Z",route: 1,location: "POINT(4.885057 52.370159)",city: "Amsterdam",category: "Attraction",name: "The Amsterdam Dungeon",},{index: {},},{"@timestamp": "2023-01-02T13:00:00Z",route: 2,location: "POINT(4.901618 52.369219)",city: "Amsterdam",category: "Museum",name: "Museum Het Rembrandthuis",},{index: {},},{"@timestamp": "2023-01-02T16:00:00Z",route: 3,location: "POINT(4.912350 52.374081)",city: "Amsterdam",category: "Museum",name: "NEMO Science Museum",},{index: {},},{"@timestamp": "2023-01-03T12:00:00Z",route: 4,location: "POINT(4.914722 52.371667)",city: "Amsterdam",category: "Museum",name: "Nederlands Scheepvaartmuseum",},{index: {},},{"@timestamp": "2023-01-04T09:00:00Z",route: 5,location: "POINT(4.401384 51.220292)",city: "Antwerp",category: "Attraction",name: "Cathedral of Our Lady",},{index: {},},{"@timestamp": "2023-01-04T12:00:00Z",route: 6,location: "POINT(4.405819 51.221758)",city: "Antwerp",category: "Museum",name: "Snijders&Rockoxhuis",},{index: {},},{"@timestamp": "2023-01-04T15:00:00Z",route: 7,location: "POINT(4.405200 51.222900)",city: "Antwerp",category: "Museum",name: "Letterenhuis",},{index: {},},{"@timestamp": "2023-01-05T10:00:00Z",route: 8,location: "POINT(2.336389 48.861111)",city: "Paris",category: "Museum",name: "Musée du Louvre",},{index: {},},{"@timestamp": "2023-01-05T14:00:00Z",route: 9,location: "POINT(2.327000 48.860000)",city: "Paris",category: "Museum",name: "Musée dOrsay",},],});console.log(response1);
コンソール
PUT tour{"mappings": {"properties": {"city": {"type": "keyword","time_series_dimension": true},"category": { "type": "keyword" },"route": { "type": "long" },"name": { "type": "keyword" },"location": { "type": "geo_point" },"@timestamp": { "type": "date" }}},"settings": {"index": {"mode": "time_series","routing_path": [ "city" ],"time_series": {"start_time": "2023-01-01T00:00:00Z","end_time": "2024-01-01T00:00:00Z"}}}}POST /tour/_bulk?refresh{"index":{}}{"@timestamp": "2023-01-02T09:00:00Z", "route": 0, "location": "POINT(4.889187 52.373184)", "city": "Amsterdam", "category": "Attraction", "name": "Royal Palace Amsterdam"}{"index":{}}{"@timestamp": "2023-01-02T10:00:00Z", "route": 1, "location": "POINT(4.885057 52.370159)", "city": "Amsterdam", "category": "Attraction", "name": "The Amsterdam Dungeon"}{"index":{}}{"@timestamp": "2023-01-02T13:00:00Z", "route": 2, "location": "POINT(4.901618 52.369219)", "city": "Amsterdam", "category": "Museum", "name": "Museum Het Rembrandthuis"}{"index":{}}{"@timestamp": "2023-01-02T16:00:00Z", "route": 3, "location": "POINT(4.912350 52.374081)", "city": "Amsterdam", "category": "Museum", "name": "NEMO Science Museum"}{"index":{}}{"@timestamp": "2023-01-03T12:00:00Z", "route": 4, "location": "POINT(4.914722 52.371667)", "city": "Amsterdam", "category": "Museum", "name": "Nederlands Scheepvaartmuseum"}{"index":{}}{"@timestamp": "2023-01-04T09:00:00Z", "route": 5, "location": "POINT(4.401384 51.220292)", "city": "Antwerp", "category": "Attraction", "name": "Cathedral of Our Lady"}{"index":{}}{"@timestamp": "2023-01-04T12:00:00Z", "route": 6, "location": "POINT(4.405819 51.221758)", "city": "Antwerp", "category": "Museum", "name": "Snijders&Rockoxhuis"}{"index":{}}{"@timestamp": "2023-01-04T15:00:00Z", "route": 7, "location": "POINT(4.405200 51.222900)", "city": "Antwerp", "category": "Museum", "name": "Letterenhuis"}{"index":{}}{"@timestamp": "2023-01-05T10:00:00Z", "route": 8, "location": "POINT(2.336389 48.861111)", "city": "Paris", "category": "Museum", "name": "Musée du Louvre"}{"index":{}}{"@timestamp": "2023-01-05T14:00:00Z", "route": 9, "location": "POINT(2.327000 48.860000)", "city": "Paris", "category": "Museum", "name": "Musée dOrsay"}
用語によるグルーピング
このデータを使用して、非時系列のユースケースの場合、都市名に基づいて 用語集約 を使用してグループ化できます。これは、tour インデックスを時系列インデックスとして定義しているかどうかにかかわらず機能します。
Python
resp = client.search(index="tour",filter_path="aggregations",aggregations={"path": {"terms": {"field": "city"},"aggregations": {"museum_tour": {"geo_line": {"point": {"field": "location"},"sort": {"field": "@timestamp"}}}}}},)print(resp)
Js
const response = await client.search({index: "tour",filter_path: "aggregations",aggregations: {path: {terms: {field: "city",},aggregations: {museum_tour: {geo_line: {point: {field: "location",},sort: {field: "@timestamp",},},},},},},});console.log(response);
コンソール
POST /tour/_search?filter_path=aggregations{"aggregations": {"path": {"terms": {"field": "city"},"aggregations": {"museum_tour": {"geo_line": {"point": {"field": "location"},"sort": {"field": "@timestamp"}}}}}}}
次のように返されます:
Js
{"aggregations": {"path": {"doc_count_error_upper_bound": 0,"sum_other_doc_count": 0,"buckets": [{"key": "Amsterdam","doc_count": 5,"museum_tour": {"type": "Feature","geometry": {"coordinates": [ [ 4.889187, 52.373184 ], [ 4.885057, 52.370159 ], [ 4.901618, 52.369219 ], [ 4.91235, 52.374081 ], [ 4.914722, 52.371667 ] ],"type": "LineString"},"properties": {"complete": true}}},{"key": "Antwerp","doc_count": 3,"museum_tour": {"type": "Feature","geometry": {"coordinates": [ [ 4.401384, 51.220292 ], [ 4.405819, 51.221758 ], [ 4.4052, 51.2229 ] ],"type": "LineString"},"properties": {"complete": true}}},{"key": "Paris","doc_count": 2,"museum_tour": {"type": "Feature","geometry": {"coordinates": [ [ 2.336389, 48.861111 ], [ 2.327, 48.86 ] ],"type": "LineString"},"properties": {"complete": true}}}]}}}
これらの結果には、各バケットが key を示す JSON オブジェクトの配列が含まれており、city フィールドの名前と、museum_tour という内部集約結果が含まれています。この結果には、GeoJSON Feature が含まれており、その都市のさまざまな観光名所間の実際のルートを説明しています。各結果には、properties オブジェクトも含まれており、complete 値が含まれ、ジオメトリが size パラメータで指定された制限に切り捨てられた場合は false になります。次の例で time_series を使用すると、構造が少し異なる同じ結果が得られます。
時系列によるグルーピング
この機能は技術プレビュー中であり、将来のリリースで変更または削除される可能性があります。Elastic は問題を修正するために作業しますが、技術プレビューの機能は公式 GA 機能のサポート SLA の対象ではありません。
以前と同じデータを使用して、time_series 集約 を使用してグループ化を行うこともできます。これは、time_series_dimension: true のすべてのフィールドの組み合わせとして定義される TSID によってグループ化されます。この場合、前の 用語集約 で使用されたのと同じ city フィールドが使用されます。この例は、tour インデックスを index.mode="time_series" を使用して時系列インデックスとして定義した場合にのみ機能します。
Python
resp = client.search(index="tour",filter_path="aggregations",aggregations={"path": {"time_series": {},"aggregations": {"museum_tour": {"geo_line": {"point": {"field": "location"}}}}}},)print(resp)
Js
const response = await client.search({index: "tour",filter_path: "aggregations",aggregations: {path: {time_series: {},aggregations: {museum_tour: {geo_line: {point: {field: "location",},},},},},},});console.log(response);
コンソール
POST /tour/_search?filter_path=aggregations{"aggregations": {"path": {"time_series": {},"aggregations": {"museum_tour": {"geo_line": {"point": {"field": "location"}}}}}}}
geo_line 集約は、time_series 集約 内にネストされている場合、もはや sort フィールドを必要としません。これは、ソートフィールドが @timestamp に設定されており、すべての時系列インデックスが事前にソートされているためです。このパラメータを設定し、@timestamp 以外の何かに設定するとエラーが発生します。
このクエリの結果は:
Js
{"aggregations": {"path": {"buckets": {"{city=Paris}": {"key": {"city": "Paris"},"doc_count": 2,"museum_tour": {"type": "Feature","geometry": {"coordinates": [ [ 2.336389, 48.861111 ], [ 2.327, 48.86 ] ],"type": "LineString"},"properties": {"complete": true}}},"{city=Antwerp}": {"key": {"city": "Antwerp"},"doc_count": 3,"museum_tour": {"type": "Feature","geometry": {"coordinates": [ [ 4.401384, 51.220292 ], [ 4.405819, 51.221758 ], [ 4.4052, 51.2229 ] ],"type": "LineString"},"properties": {"complete": true}}},"{city=Amsterdam}": {"key": {"city": "Amsterdam"},"doc_count": 5,"museum_tour": {"type": "Feature","geometry": {"coordinates": [ [ 4.889187, 52.373184 ], [ 4.885057, 52.370159 ], [ 4.901618, 52.369219 ], [ 4.91235, 52.374081 ], [ 4.914722, 52.371667 ] ],"type": "LineString"},"properties": {"complete": true}}}}}}}
これらの結果は、前の terms 集約の例と本質的に同じですが、構造が異なります。ここでは、バケットがマップとして返され、キーは TSID の内部説明です。この TSID は、time_series_dimension: true を持つフィールドのユニークな組み合わせごとにユニークです。各バケットには、key フィールドが含まれており、これは TSID のすべての次元値のマップでもあります。この場合、グループ化には都市名のみが使用されます。さらに、museum_tour という内部集約結果が含まれており、GeoJSON Feature が含まれており、その都市のさまざまな観光名所間の実際のルートを説明しています。各結果には、properties オブジェクトも含まれており、complete 値が含まれ、ジオメトリが size パラメータで指定された制限に簡略化された場合は false になります。
なぜ時系列でグループ化するのか?
これらの例を見ていると、terms または time_series を使用してジオラインをグループ化することの違いはほとんどないと思うかもしれません。しかし、2つのケース間には重要な動作の違いがあります。時系列インデックスは、ディスク上で非常に特定の順序で保存されます。これらは、時系列次元フィールドによって事前にグループ化され、@timestamp フィールドによって事前にソートされています。これにより、geo_line 集約が大幅に最適化されます:
- 最初のバケットに割り当てられた同じメモリを、すべての後続のバケットに何度も再利用できます。これは、すべてのバケットが同時に収集される非時系列ケースで必要とされるメモリよりも大幅に少なくなります。
- ソートは必要ありません。データは
@timestampによって事前にソートされているためです。時系列データは、DESC順序で集約コレクターに自然に到着します。これは、sort_order:ASC(デフォルト) を指定しても、DESC順序で収集されますが、最終的なLineStringジオメトリを生成する前に効率的なメモリ内逆順を実行します。 sizeパラメータは、ストリーミングライン簡略化アルゴリズムに使用できます。時系列がない場合、デフォルトではバケットごとに10000ドキュメントの後にデータを切り捨てる必要があります。これにより、メモリ使用量が無制限になるのを防ぎます。これにより、ジオラインが切り捨てられ、重要なデータが失われる可能性があります。時系列を使用すると、ストリーミングライン簡略化アルゴリズムを実行でき、メモリ使用量を制御しながら、全体のジオメトリ形状を維持できます。実際、ほとんどのユースケースでは、このsizeパラメータをはるかに低い制限に設定して、さらに多くのメモリを節約することができます。例えば、geo_lineが特定の解像度の表示マップに描画される場合、100または200ポイントに簡略化しても同じように見えるかもしれません。これにより、サーバー、ネットワーク、クライアントのメモリが節約されます。
注意: 時系列データを扱い、time_series インデックスモードを使用することには、他にも重要な利点があります。これらは、時系列データストリーム に関するドキュメントで説明されています。
ストリーミングライン簡略化
ライン簡略化は、クライアントに送信され、マップユーザーインターフェースに表示される最終結果のサイズを削減する優れた方法です。しかし、通常、これらのアルゴリズムは簡略化を実行するために多くのメモリを使用し、簡略化自体のサポートデータとともに、全体のジオメトリをメモリに保持する必要があります。ストリーミングライン簡略化アルゴリズムを使用すると、簡略化プロセス中のメモリ使用量を最小限に抑え、簡略化されたジオメトリのために定義された境界にメモリを制約することができます。これは、time_series 集約 によってグループ化が行われ、time_series インデックスモードを持つインデックスで実行される場合にのみ可能です。
これらの条件下で、geo_line 集約は指定された size にメモリを割り当て、その後、受信したドキュメントでそのメモリを埋めます。メモリが完全に埋まると、新しいドキュメントが追加されると、ライン内のドキュメントが削除されます。削除するドキュメントの選択は、ジオメトリへの視覚的影響を最小限に抑えるように行われます。このプロセスは、Visvalingam–Whyatt アルゴリズム を利用します。基本的に、これは、考慮中のポイントとライン内の前後の2つのポイントによって定義される三角形の最小面積を持つポイントが削除されることを意味します。さらに、平面の歪みが選択に影響しないように、球面座標を使用して面積を計算します。
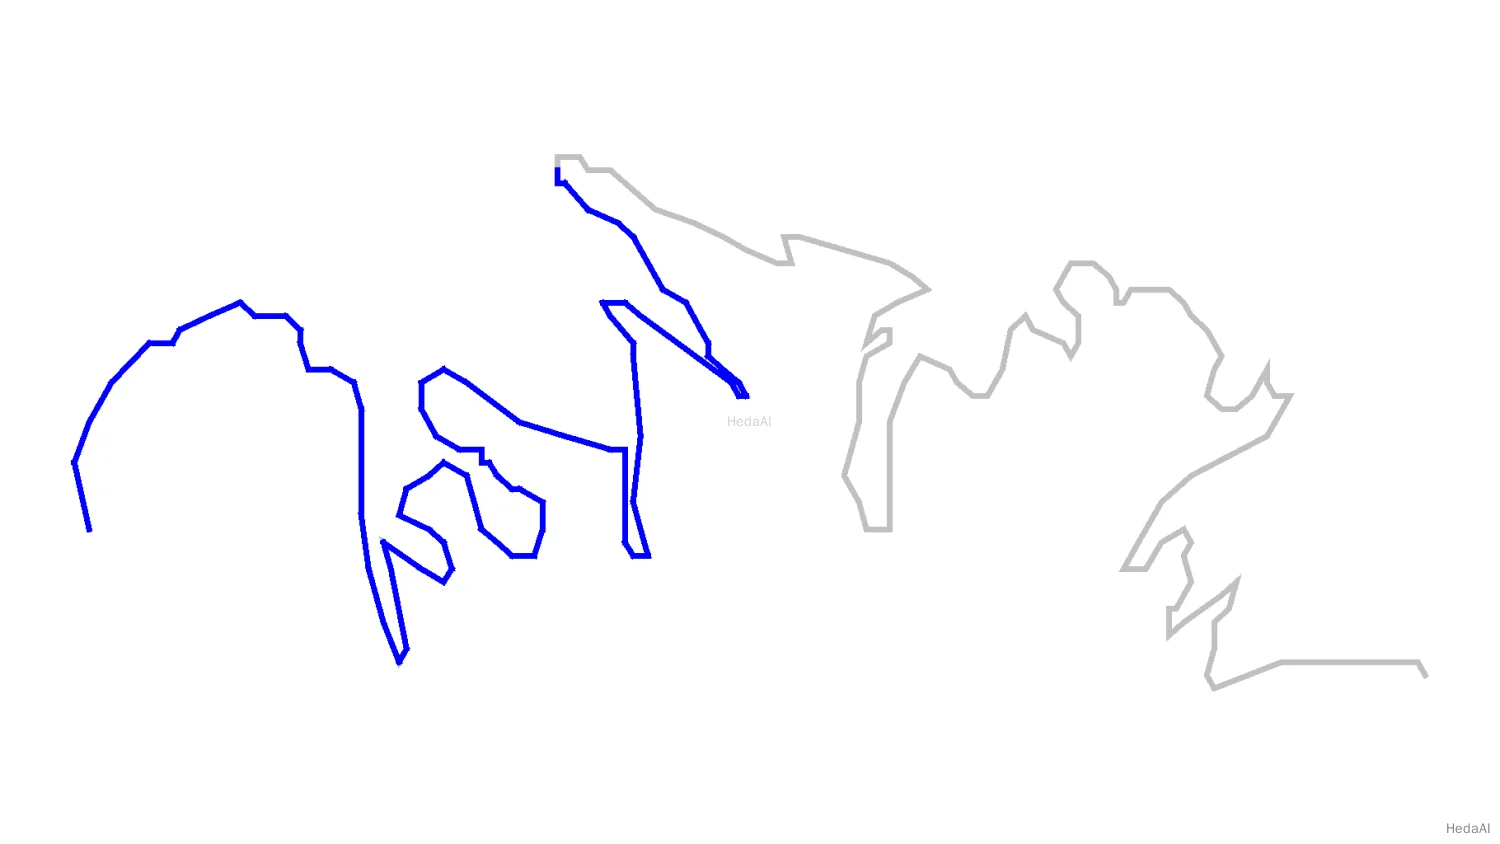
ライン切り捨てよりもライン簡略化がどれほど優れているかを示すために、コディアック島の北岸のこの例を考えてみましょう。このデータは209ポイントしかありませんが、size を 100 に設定したい場合、劇的な切り捨てが発生します。

灰色のラインは209ポイントの全ジオメトリであり、青いラインは最初の100ポイントであり、元のジオメトリとは非常に異なります。
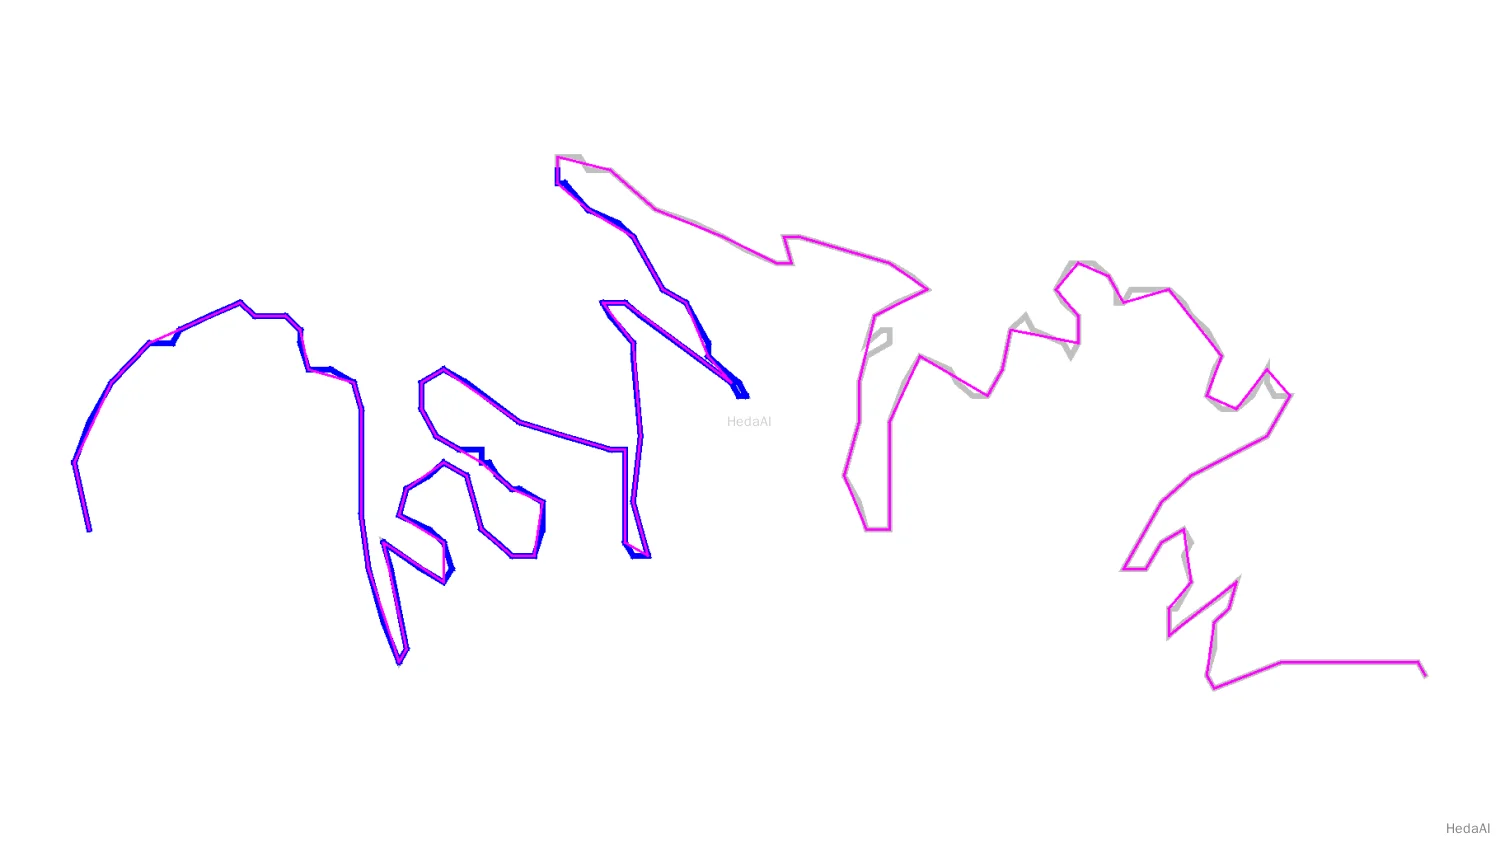
同じジオメトリを100ポイントに簡略化した場合を考えてみましょう。

比較のために、元のものを灰色で、切り捨てたものを青で、新しい簡略化されたジオメトリをマゼンタで示しました。新しい簡略化されたラインが元のラインからどのように逸脱しているかを見ることができますが、全体のジオメトリはほぼ同じに見え、コディアック島の北岸として明確に認識できます。
